Pairtools benchmarking
Welcome to pairtools benchmarking. These are the instructions on how to test performance of different software for mapping Hi-C and Hi-C-like methods. Mapping usually results in the file with mapped pairs, which is then converted into binned matrix format. Pairs format is the “rawest” interpretable type of data after reads.
Reviewing the literature suggests that there are at least 6 methods to map Hi-C and Hi-C-like data. These include:
pairtools is a lightweight Python CLI that extracts and manipulates Hi-C contacts post-alignment. Aslignment can be done by:
bwa mem
bwa-mem2, ahn optimized version of bwa mem, which x2-2.5 improves speed over bwa
chromap is a fast alignment tool for chromatin profiles, not specialized for Hi-C but parameterized for a broad range of sequencing data including Hi-C short reads.
Does not require separate step of mapping.
HiC-Pro is a pipeline for Hi-C and DNase-C mapping, “optimized and flexible”.
It calls mapping within. By default, creates the output cooler files with binned data, but the script can be tinkered in order to stop the processing at the step of pairs.
Juicer is a platform for analysis of Hi-C data, which is already adapted to a wide range of cluster types.
It calls mapping within. Has an option to stop the data processing at the step of pairs, without further construction of binned matrices.
HiCExplorer is a broad-range set of tools for processing, normalization, analysis and visualization Hi-C and Hi-C-like methods.
FAN-C is a set of CLI tools that runs the mapping (bowtie or bwa mem), extracts and manipulates Hi-C contacts. It also has the tools for data visualization and downstream analysis.
TADbit is multi-task Python API that handles all the steps from the alignment of paired-end reads to the detection of Topologically Associating Domain (TAD) borders, compartments and three-dimensional modeling of chromatin based on interaction matrices.
We benchmark these programs on one million of representative reads. These reads are taken from random replicate from Rao SSP et al., “Cohesin Loss Eliminates All Loop Domains.”, Cell, 2017 Oct 5;171(2):305-320.e24 Generally, it is useful to assess how much computational time you need per million of reads. As long as you have this assessment, you may multiply the size of your experiment by the whole library size (in mlns of reads), because we expect linear growth of computational complexity of reads mapping with library size.
The benchmarking consists of four general steps. If you want to reproduce it, you need to run steps 1 and 2 manually in order to create the working environment, and then use snakemake script to run the benchmarks. You may use the commands form the “3. Run” section to get an understanding how each indiviaul framework works and what parameters can be changed. Note that you need separate run of juicer with single value of –ncores, because it does not support parallel launches (because it writes to the default output). Finally, there is a visualization section with a display of all the results that we calcualted on our machines.
1. Install software
We will use separate conda environments to install different utilities. Each utility will have its own environment and peth to the binaries.
[ ]:
%%bash
mkdir ./soft
pairtools
pairtools v1.0.2
[ ]:
%%bash
conda create -y --prefix soft/pairtools1.0.2 python=3.9 pip
conda activate soft/pairtools1.0.2
pip install cython numpy pysam
pip install git+https://github.com/open2c/pairtools.git@v1.0.2

conda install -c conda-forge lz4-c # conda install -c anaconda lz4

conda install -y -c bioconda "bwa>=0.7.17"
bwa-mem2
[ ]:
%%bash
conda activate soft/pairtools1.0.2

# bwa-mem2: compile from source (not recommended for general users)

# Get the source
git clone --recursive https://github.com/bwa-mem2/bwa-mem2 soft/bwa-mem2
cd soft/bwa-mem2

# Compile
make

# Exit compilation folder
cd ../../
chromap
[ ]:
%%bash
conda create -y --prefix soft/chromap
conda activate soft/chromap
conda install -y -c bioconda -c conda-forge chromap
HiC-Pro
HiC-Pro is a popular software for Hi-C mapping, its now part of nf-core Hi-C pipeline, supports both fragment-based analysis of Hi-C and fragement-free analysis of DNase-based Hi-C.
[ ]:
%%bash
git clone https://github.com/nservant/HiC-Pro.git soft/HiC-Pro_env/HiC-Pro
conda env create -f soft/HiC-Pro_env/HiC-Pro/environment.yml -p soft/HiC-Pro_env
### Working environment will be soft/HiC-Pro_env

conda activate soft/HiC-Pro_env

# Install dependencies
conda install -y -c bioconda bowtie2 samtools pysam numpy scipy bx-python
conda install -y -c r r r-rcolorbrewer r-ggplot2

# Copy prepared config:
cp configs/config-hicpro_install.txt soft/HiC-Pro_env/HiC-Pro/config-install.txt
cp configs/config-hicpro.txt soft/HiC-Pro_env/HiC-Pro/config-hicpro.txt

# Configure and install:
cd soft/HiC-Pro_env/HiC-Pro
make configure
make install

cd ../../../

# Patch the code to retain only data processing steps with no creating of maps:
sed -i "s/all : init mapping proc_hic merge_persample hic_qc build_raw_maps ice_norm/all : init mapping proc_hic merge_persample #hic_qc build_raw_maps ice_norm/" soft/HiC-Pro_env/HiC-Pro/scripts/Makefile
[ ]:
%%bash
# Note that the configs should be adjusted for your system:
cp configs/config-hicpro_install.txt soft/HiC-Pro_env/HiC-Pro/config-install.txt
cp configs/config-hicpro.txt soft/HiC-Pro_env/HiC-Pro/config-hicpro.txt
FAN-C
[ ]:
%%bash
conda create -y --prefix soft/fanc python=3.9 pip hdf5
conda activate soft/fanc
pip install fanc
conda install -y -c bioconda samtools
Juicer
[ ]:
%%bash

conda create -y --prefix soft/juicer
conda activate soft/juicer

conda install -y -c bioconda bwa java-jdk
conda install -y -c conda-forge coreutils

# Download the recommended stable version:
wget https://github.com/aidenlab/juicer/archive/refs/tags/1.6.zip
unzip 1.6.zip
rm 1.6.zip
mv juicer-1.6 soft/juicer-1.6

# Download compile jar files of the stable  version:
wget http://hicfiles.tc4ga.com.s3.amazonaws.com/public/juicer/juicer_tools.1.6.2_jcuda.0.7.5.jar
mv juicer_tools.1.6.2_jcuda.0.7.5.jar soft/juicer-1.6/CPU/scripts/common/juicer_tools.jar

# Copy the scripts to some accessible location:
mkdir -p soft/juicer-1.6/CPU/scripts/
cp -r soft/juicer-1.6/CPU/[^s]* soft/juicer-1.6/CPU/scripts/
HiCExplorer
[ ]:
%%bash

conda create -y --prefix soft/hicexplorer python=3.9
conda activate soft/hicexplorer
conda install -y -c bioconda hicexplorer bwa
TADbit
[ ]:
%%bash

conda create -y --prefix soft/tadbit
conda activate soft/tadbit

# # Install mappers:
conda install -y -q -c bioconda gem3-mapper bowtie2

# install tadbit
conda install -y -q -c bioconda tadbit
2. Download data and genome
[ ]:
%%bash

mkdir data
Download raw data
Test data from Rao et al. 2017, 1 mln pairs:
[ ]:
%%bash

fastq-dump -O data --gzip --split-files SRR6107789 --minSpotId 0 --maxSpotId 1000000
[ ]:
%%bash

# Put the data in accessible folder for juicer:
mkdir -p data/4juicer/fastq/
mkdir -p data/4juicer/splits/
cp data/SRR6107789_1.fastq.gz data/4juicer/fastq/SRR6107789_R1.fastq.gz
cp data/SRR6107789_2.fastq.gz data/4juicer/fastq/SRR6107789_R2.fastq.gz
cp data/4juicer/fastq/* data/4juicer/splits/
[ ]:
%%bash

# Put the data in accessible folder for HiC-Pro:
mkdir -p soft/HiC-Pro_env/HiC-Pro/rawdata/sample1
cp data/S*fastq.gz soft/HiC-Pro_env/HiC-Pro/rawdata/sample1/
Install genome
Genomepy installation
will install fasta, bwa and bowtie2 indexes:
[ ]:
%%bash

# Activate bwa plugin for genomepy:
! genomepy plugin enable bwa bowtie2
[ ]:
%%bash

# Install hg38 genome by genomepy:
! genomepy install hg38 -g data/
[ ]:
%%bash

# Restrict the genome:
! cooler digest data/hg38/hg38.fa.sizes data/hg38/hg38.fa DpnII --rel-ids 1 -o data/hg38/hg38.DpnII.bed
Build genome index: bwa-mem2
[ ]:
%%bash
mkdir data/hg38/index/bwa-mem2/
soft/bwa-mem2/bwa-mem2 index -p data/hg38/index/bwa-mem2/hg38 data/hg38/hg38.fa
Build genome index: chromap
[ ]:
%%bash
mkdir data/hg38/index/chromap
chromap -i -r data/hg38/hg38.fa -o data/hg38/index/chromap/hg38
Build genome index: GEM
[ ]:
%%bash
mkdir data/hg38/index/gem
gem-indexer -T 8 -i data/hg38/hg38.fa -o data/hg38/index/gem/hg38
3. Run
The banchmarking is usually cumbersome, but it can be simplified by snakemake. We provide a Snakemake pipeline that will allow you to benchmark different approaches.
The output of snakemake will consist of resulting Hi-C pairs/maps in output folder and benchmarking files in benchmarks folder. The file names have the information on parameters in their names:
[ ]:
%%bash

# Running
snakemake --cores 10
[ ]:
%%bash

# Cleanup (only if you want to erase all the output)
rm output/*; rm benchmarks/*
Manual run
You may also run them to test individual steps of the pipeline.
pairtools
[ ]:
%%bash

soft/bwa-mem2/bwa-mem2 mem -t 5 -SP data/hg38/index/bwa-mem2/hg38 data/SRR6107789_1.fastq.gz data/SRR6107789_2.fastq.gz | \
    soft/pairtools1.0.2/bin/pairtools parse --nproc-in 5 --nproc-out 5 --drop-sam --drop-seq -c data/hg38/hg38.fa.sizes | \
    soft/pairtools1.0.2/bin/pairtools sort --nproc 5 | \
    soft/pairtools1.0.2/bin/pairtools dedup -p 5 --backend cython \
    -o output/result.pairtools.pairs
chromap
[ ]:
%%bash

soft/chromap/bin/chromap --preset hic --low-mem \
    -t 5 -x data/hg38/index/chromap/hg38 -r data/hg38/hg38.fa \
    -1 data/SRR6107789_1.fastq.gz -2 data/SRR6107789_2.fastq.gz -o output/result.chromap.pairs
HiC-Pro
[ ]:
%%bash

cd soft/HiC-Pro_env/HiC-Pro
bin/HiC-Pro -i rawdata/ -o output -c config-hicpro.txt

cd ../../../
FAN-C
Based on CLI tutorial:
[ ]:
%%bash

fanc map -t 5 data/SRR6107789_1.fastq.gz data/hg38/index/bwa/hg38.fa output/fanc-output_1.bam
fanc map -t 5 data/SRR6107789_2.fastq.gz data/hg38/index/bwa/hg38.fa output/fanc-output_2.bam
samtools sort -@ 5 -n output/fanc-output_1.bam -o output/fanc-output_1.sorted.bam
samtools sort -@ 5 -n output/fanc-output_2.bam -o output/fanc-output_2.sorted.bam
fanc pairs output/fanc-output_1.sorted.bam output/fanc-output_2.sorted.bam output/fanc-output.pairs -g data/hg38/hg38.DpnII.bed
Juicer
[ ]:
%%bash

soft/juicer-1.6/CPU/juicer.sh -g hg38 -d data/4juicer/ -s DpnII -S early -p data/hg38/hg38.fa.sizes -y data/hg38/hg38.DpnII.bed -z data/hg38/index/bwa/hg38.fa -t 5 -D soft/juicer-1.6/CPU
HiCExplorer
Based on the example: https://hicexplorer.readthedocs.io/en/latest/content/example_usage.html
Note that it does not procude the pairs, but binned coolers.
[ ]:
%%bash

hicBuildMatrix --samFiles \
    <(bwa mem -t 4 -A1 -B4 -E50 -L0 data/hg38/index/bwa/hg38.fa data/SRR6107789_1.fastq.gz | samtools view -Shb -) \
    <(bwa mem -t 4 -A1 -B4 -E50 -L0 data/hg38/index/bwa/hg38.fa data/SRR6107789_2.fastq.gz | samtools view -Shb -) \
     --restrictionSequence GATC \
     --danglingSequence GATC \
     --restrictionCutFile data/hg38/hg38.DpnII.bed \
     --threads 4 \
     --inputBufferSize 100000 \
     --QCfolder hicexplorer_tmp \
     -o hicexplorer_output.cool
TADbit
[ ]:
%%bash

tadbit map tadbit_output --fastq data/SRR6107789_1.fastq.gz --read 1 --index data/hg38/index/gem/hg38.gem --renz DpnII
tadbit map tadbit_output --fastq data/SRR6107789_2.fastq.gz --read 2 --index data/hg38/index/gem/hg38.gem --renz DpnII

tadbit parse tadbit_output --genome data/hg38/hg38.fa

tadbit filter tadbit_output --format short
Read mapping only
[ ]:
%%bash

# bwa mem
soft/pairtools0.3.0/bin/bwa mem -t 4 -SP data/hg38/index/bwa/hg38.fa data/SRR6107789_1.fastq.gz data/SRR6107789_2.fastq.gz > bwa-mem.sam

# bwa mem2
soft/bwa-mem2/bwa-mem2 mem -t 4 -SP data/hg38/index/bwa-mem2/hg38 data/SRR6107789_1.fastq.gz data/SRR6107789_2.fastq.gz > bwa-mem2.sam

# bowtie2 only
soft/tadbit/bin/bowtie2 -p 4 -x data/hg38/index/bowtie2/hg38 -1 data/SRR6107789_1.fastq.gz -2 data/SRR6107789_2.fastq.gz -S bowtie2.sam
4. Visualize benchmarks
[2]:
# Check the CPU properties:
import psutil
print(f"{psutil.cpu_count()} CPUs at {psutil.cpu_freq().current:.0f} GHz")
36 CPUs at 1211 GHz
[3]:
import pandas as pd
import seaborn as sns
import numpy as np
import matplotlib as mpl
import matplotlib.pyplot as plt
%matplotlib inline

mpl.rcParams['font.family'] = "sans-serif"
figsize_A4 = np.array([11.69, 8.27])
plt.rcParams["figure.figsize"] = figsize_A4.T
plt.rcParams['figure.facecolor']='white'
plt.rcParams['font.size']=16

import glob
[4]:
## If you start from .csv. file:
# df = pd.read_csv('benchmarking_1mln.csv')
[13]:
# If you start from your own benchmarks:
files = glob.glob("benchmarks/*") #+ glob.glob("benchmarks_v1_2022/*")# +
print(len(files))
39
[14]:
def get_params(filename):
    split = filename.split('.')
    util= split[1]
    ncores = int(split[2])

    return util, ncores

timings = []
for f in files:
    t = pd.read_table(f)
    t[['util', 'ncores']] = get_params(f)
    timings.append(t)
timings = pd.concat(timings)
[15]:
timings.head()
[15]:
| s | h:m:s | max_rss | max_vms | max_uss | max_pss | io_in | io_out | mean_load | cpu_time | util | ncores | |
|---|---|---|---|---|---|---|---|---|---|---|---|---|
| 0 | 482.1029 | 0:08:02 | 17068.97 | 20572.73 | 16931.91 | 16951.71 | 16275.21 | 0.02 | 102.18 | 493.82 | pairtools_bwamem2 | 1 |
| 1 | 482.5261 | 0:08:02 | 17079.46 | 20508.73 | 16941.46 | 16956.34 | 32534.11 | 39.25 | 101.73 | 498.88 | pairtools_bwamem2 | 1 |
| 2 | 488.9997 | 0:08:08 | 17055.04 | 20508.59 | 16920.96 | 16939.69 | 42104.61 | 78.47 | 100.17 | 502.58 | pairtools_bwamem2 | 1 |
| 3 | 484.3460 | 0:08:04 | 16981.59 | 20380.60 | 16961.30 | 16962.37 | 45493.36 | 117.70 | 93.06 | 50.54 | pairtools_bwamem2 | 1 |
| 4 | 483.3159 | 0:08:03 | 16969.02 | 20595.51 | 16944.75 | 16945.79 | 61922.79 | 156.93 | 99.61 | 507.64 | pairtools_bwamem2 | 1 |
[87]:
df = timings.sort_values(['ncores', 'util'])
[88]:
df.to_csv('benchmarking_1mln.csv')
[17]:
np.unique(df.util)
[17]:
array(['bowtie', 'bwamem', 'bwamem2', 'chromap', 'fanc_bowtie2',
       'fanc_bwa', 'hicexplorer', 'hicpro', 'juicer', 'pairtools',
       'pairtools_bwamem2', 'tadbit', 'tadbit_bowtie2'], dtype=object)
[21]:
labels = [
    'chromap',
    'pairtools_bwamem2',
    'tadbit',
    'pairtools',
    'tadbit_bowtie2',
    'juicer',
    'hicpro',
    'hicexplorer',
    'fanc_bwa',
    'fanc_bowtie2',
    'bwamem2',
    'bwamem',
    'bowtie',
]
labels_mod = [
    'Chromap',
    'bwa-mem2 + pairtools',
    'GEM + TADbit',
    'bwa mem + pairtools',
    'bowtie2 + TADbit',
    'Juicer',
    'Hi-Pro',
    'HiCExplorer',
    'bwa mem + FANC',
    'bowtie2 + FANC',
    'bwa-mem2',
    'bwa mem',
    'bowtie2',
]
[24]:
fig, axes = plt.subplots(nrows=1, ncols=2, sharey=True)
cmap = ['#FD7F69', '#9FC9DD', '#89A76F']
style_dict = dict(
orient='h',
palette=cmap,
edgecolor="k",
linewidth=2.0,
errwidth=2.0,
capsize=0.07)
ax = axes[0]
b = sns.barplot(x="s",
y="util",
data=df.sort_values('util'),
order=labels,
hue='ncores',
hue_order=[4,2,1],
ax=ax,
**style_dict
)
plt.setp(b.patches, linewidth=0.5)
ax.set_ylabel('')
ax.set_xlabel('Time (sec)')
ax.set_yticklabels(labels_mod)
ax.set_axisbelow(True)
ax.grid(which='both', axis='x', color='k')
#ax.set_xscale('log')
ax.set_xlim([0, 5e3])
ax.set_xticks(np.arange(0, 6000, 100), minor=True)
ax.grid(which='minor', axis='x', alpha=0.2, color='k')
ax.get_legend().remove()
ax = axes[1]
b = sns.barplot(x="max_rss",
y="util",
data=df.sort_values('util'),
order=labels,
hue='ncores',
hue_order=[4,2,1],
ax=ax,
**style_dict)
plt.setp(b.patches, linewidth=0.5)
ax.set_ylabel('')
ax.set_xlabel('Maximum Resident Set Size (MB)')
ax.set_yticklabels(labels_mod)
ax.set_axisbelow(True)
ax.grid(which='both', axis='x', color='k')
ax.set_xticks(np.arange(0, 30000, 1000), minor=True)
ax.grid(which='minor', axis='x', alpha=0.2, color='k')
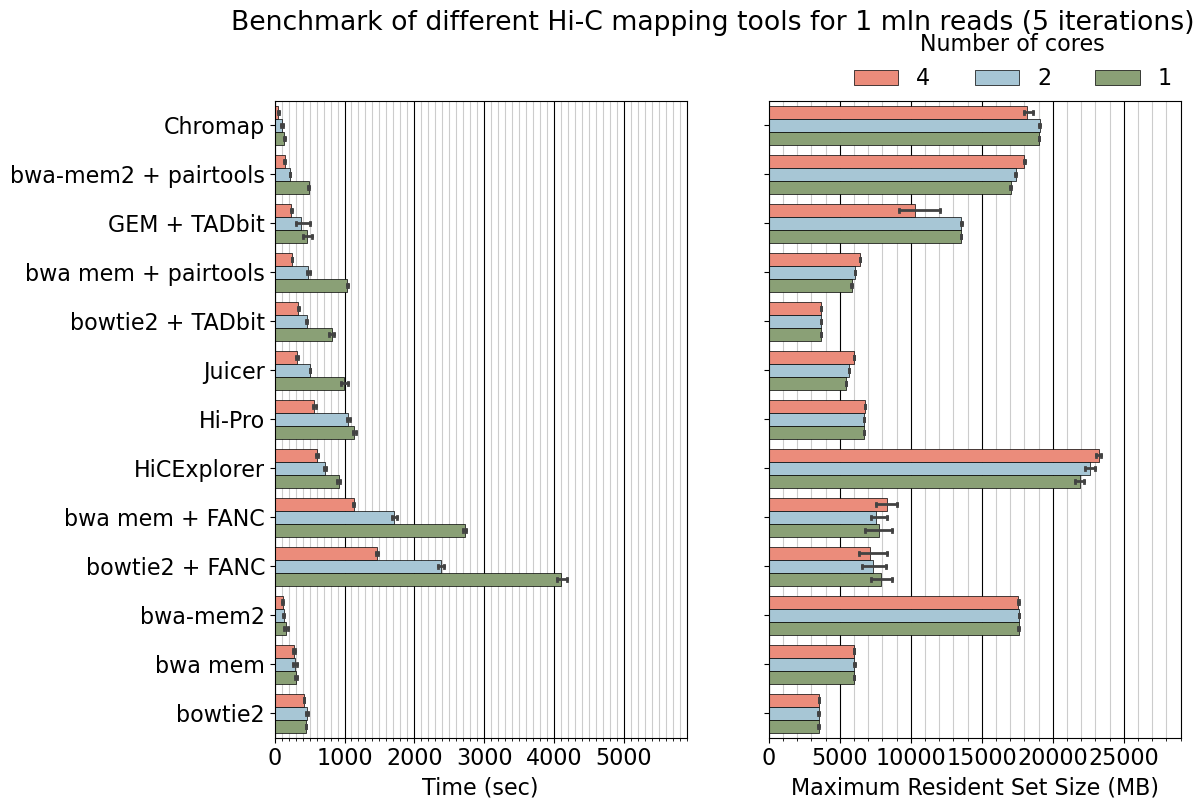
fig.suptitle('Benchmark of different Hi-C mapping tools for 1 mln reads (5 iterations)', y=0.99)
# (x, y, width, height)
bb = (fig.subplotpars.left, fig.subplotpars.top+0.002, fig.subplotpars.right-fig.subplotpars.left, 0.2)
ax.legend(bbox_to_anchor=bb, title="Number of cores", loc="lower right", ncol=3, borderaxespad=0., bbox_transform=fig.transFigure, frameon=False)
plt.savefig("benchmarking_1mln.pdf")
[25]:
fig, axes = plt.subplots(nrows=1, ncols=2, sharey=True)
cmap = ['#FD7F69', '#9FC9DD', '#89A76F']
style_dict = dict(
orient='h',
palette=cmap,
edgecolor="k",
linewidth=2.0,
errwidth=2.0,
capsize=0.07)
ax = axes[0]
b = sns.barplot(x="s",
y="util",
data=df.sort_values('util'),
order=labels,
hue='ncores',
hue_order=[4,2,1],
ax=ax,
**style_dict
)
plt.setp(b.patches, linewidth=0.5)
ax.set_ylabel('')
ax.set_xlabel('Time (sec)')
ax.set_yticklabels(labels_mod)
ax.set_axisbelow(True)
ax.grid(which='both', axis='x', color='k')
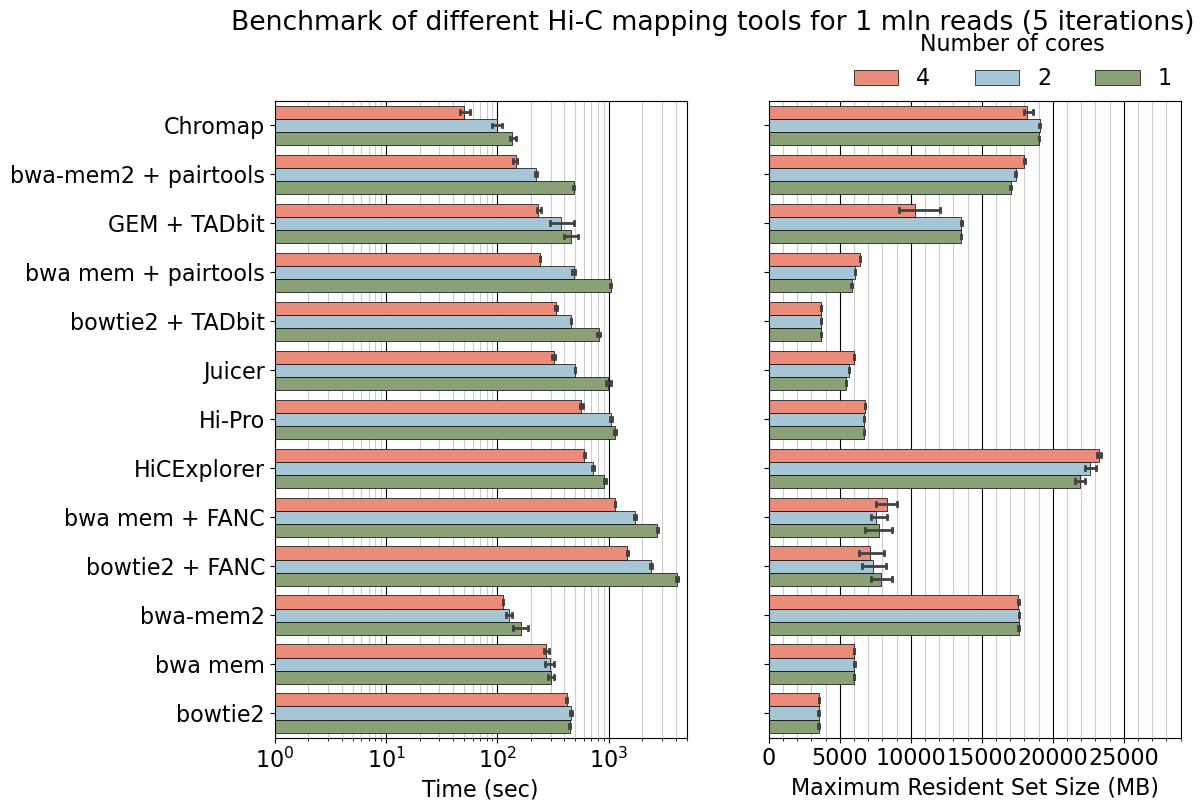
ax.set_xscale('log')
ax.set_xlim([1, 5e3])
# ax.set_xticks(np.arange(0, 5000, 100), minor=True)
ax.grid(which='minor', axis='x', alpha=0.2, color='k')
ax.get_legend().remove()
ax = axes[1]
b = sns.barplot(x="max_rss",
y="util",
data=df.sort_values('util'),
order=labels,
hue='ncores',
hue_order=[4,2,1],
ax=ax,
**style_dict)
plt.setp(b.patches, linewidth=0.5)
ax.set_ylabel('')
ax.set_xlabel('Maximum Resident Set Size (MB)')
ax.set_yticklabels(labels_mod)
ax.set_axisbelow(True)
ax.grid(which='both', axis='x', color='k')
ax.set_xticks(np.arange(0, 30000, 1000), minor=True)
ax.grid(which='minor', axis='x', alpha=0.2, color='k')
fig.suptitle('Benchmark of different Hi-C mapping tools for 1 mln reads (5 iterations)', y=0.99)
# (x, y, width, height)
bb = (fig.subplotpars.left, fig.subplotpars.top+0.002, fig.subplotpars.right-fig.subplotpars.left, 0.2)
ax.legend(bbox_to_anchor=bb, title="Number of cores", loc="lower right", ncol=3, borderaxespad=0., bbox_transform=fig.transFigure, frameon=False)
plt.savefig("benchmarking_1mln_log.pdf")
[89]:
labels = [
    'chromap',
    'pairtools_bwamem2',
    'tadbit',
    'pairtools',
    'tadbit_bowtie2',
    'juicer',
    'hicpro',
    'hicexplorer',
    'fanc_bwa',
    'fanc_bowtie2',
    # 'bwamem2',
    # 'bwamem',
    # 'bowtie',
]
labels_mod = [
    'Chromap',
    'bwa-mem2 + pairtools',
    'GEM + TADbit',
    'bwa mem + pairtools',
    'bowtie2 + TADbit',
    'Juicer',
    'Hi-Pro',
    'HiCExplorer',
    'bwa mem + FANC',
    'bowtie2 + FANC',
    # 'bwa-mem2',
    # 'bwa mem',
    # 'bowtie2',
]
[90]:
df = timings.sort_values(['ncores', 'util'])
df.loc[:, "max_rss_gb"] = df.loc[:, "max_rss"]/1024
df.loc[:, "min"] = df.loc[:, "s"]
[91]:
fig, axes = plt.subplots(nrows=1, ncols=2, sharey=True)
cmap = ['#FD7F69', '#9FC9DD', '#89A76F']
style_dict = dict(
orient='h',
palette=cmap,
edgecolor="k",
linewidth=2.0,
errwidth=2.0,
capsize=0.07)
ax = axes[0]
b = sns.barplot(x="s",
y="util",
data=df.sort_values('util'),
order=labels,
hue='ncores',
hue_order=[4,2,1],
ax=ax,
**style_dict
)
plt.setp(b.patches, linewidth=0.5)
ax.set_ylabel('')
ax.set_xlabel('Time (sec)')
ax.set_yticklabels(labels_mod)
ax.set_axisbelow(True)
ax.grid(which='both', axis='x', color='k')
#ax.set_xscale('log')
ax.set_xlim([0, 5e3])
ax.set_xticks(np.arange(0, 5000, 100), minor=True)
ax.grid(which='minor', axis='x', alpha=0.2, color='k')
ax.get_legend().remove()
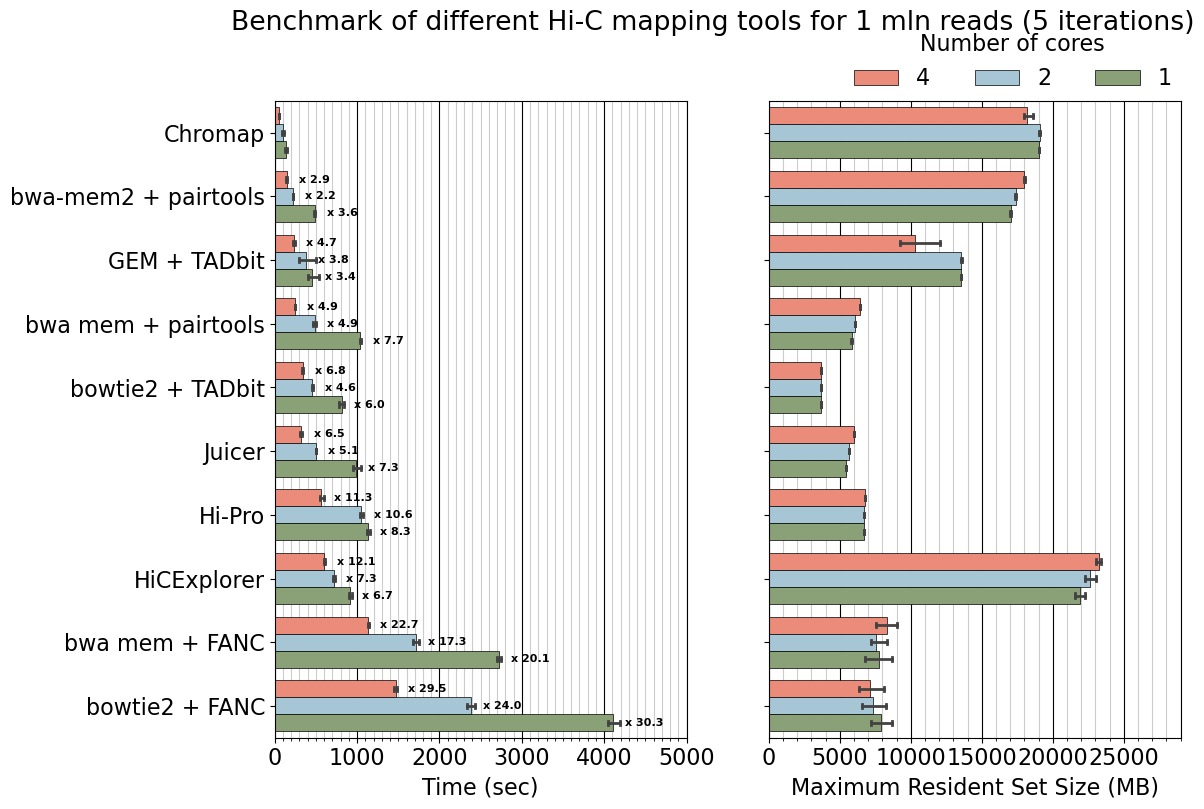
# Add text, slowdown over chromap
ncores_order = [4, 2, 1]
for icore, ncores in enumerate(ncores_order):
for ilabels, util in enumerate(labels):
if util=="chromap":
continue
df_reference = df.query(f'ncores=={ncores} and util=="chromap"')
mean_reference = np.mean(df_reference['min'].values)
df_target = df.query(f'ncores=={ncores} and util=="{util}"')
mean_target = np.mean(df_target['min'].values)
slowdown = mean_target / mean_reference
w = b.patches[0].get_height()
b.text( s=f"x {slowdown:.1f}",
x=mean_target+150, y=ilabels + (icore-1)*w,
ha = 'left', va = 'center', fontsize=8, weight='bold')
ax = axes[1]
b = sns.barplot(x="max_rss",
y="util",
data=df.sort_values('util'),
order=labels,
hue='ncores',
hue_order=[4,2,1],
ax=ax,
**style_dict)
plt.setp(b.patches, linewidth=0.5)
ax.set_ylabel('')
ax.set_xlabel('Maximum Resident Set Size (MB)')
ax.set_yticklabels(labels_mod)
ax.set_axisbelow(True)
ax.grid(which='both', axis='x', color='k')
ax.set_xticks(np.arange(0, 30000, 1000), minor=True)
ax.grid(which='minor', axis='x', alpha=0.2, color='k')
fig.suptitle('Benchmark of different Hi-C mapping tools for 1 mln reads (5 iterations)', y=0.99)
# (x, y, width, height)
bb = (fig.subplotpars.left, fig.subplotpars.top+0.002, fig.subplotpars.right-fig.subplotpars.left, 0.2)
ax.legend(bbox_to_anchor=bb, title="Number of cores", loc="lower right", ncol=3, borderaxespad=0., bbox_transform=fig.transFigure, frameon=False)
plt.savefig("benchmarking_1mln.pdf")
[92]:
dct_mapper = {
    'bowtie': 'bowtie',
    'bwamem': 'bwamem',
    'bwamem2': 'bwamem2',
    'chromap': "",
    'fanc_bowtie2': 'bowtie',
    'fanc_bwa': 'bwamem',
    'hicexplorer': 'bwamem',
    'hicpro':'bowtie',
    'juicer': 'bwamem',
    'pairtools': 'bwamem',
    'pairtools_bwamem2': 'bwamem2',
    'tadbit': 'GEM',
    'tadbit_bowtie2': 'bowtie'
}
df.loc[:, "mapper"] = df.util.replace(dct_mapper)
[93]:
df = pd.merge(df, df, left_on=['mapper', 'ncores'], right_on=['util', 'ncores'], suffixes=["", "_mapper"])
[94]:
labels = [
    'pairtools_bwamem2',
    # 'tadbit',
    'pairtools',
    'tadbit_bowtie2',
    'juicer',
    'fanc_bwa',
    'hicexplorer',
    'hicpro',
    'fanc_bowtie2',
    # 'bwamem2',
    # 'bwamem',
    # 'bowtie',
]
labels_mod = [
    'bwa-mem2 + pairtools',
    # 'GEM + TADbit',
    'bwa mem + pairtools',
    'bowtie2 + TADbit',
    'Juicer',
    'bwa mem + FANC',
    'HiCExplorer',
    'Hi-Pro',
    'bowtie2 + FANC',
    # 'bwa-mem2',
    # 'bwa mem',
    # 'bowtie2',
]
[113]:
fig, axes = plt.subplots(nrows=1, ncols=2, sharey=True)
cmap = ['#FD7F69', '#9FC9DD', '#89A76F']
style_dict = dict(
orient='h',
palette=cmap,
edgecolor="k",
linewidth=2.0,
errwidth=2.0,
capsize=0.07)
cmap1 = ['#ECECEC', '#BFBFBF', '#868686']
style_dict1 = dict(
orient='h',
palette=cmap1,
edgecolor="k",
linewidth=2.0,
errwidth=2.0,
capsize=0.07,
alpha=0.8)
ax = axes[0]
b = sns.barplot(x="s",
y="util",
data=df.sort_values('util'),
order=labels,
hue='ncores',
hue_order=[4,2,1],
ax=ax,
**style_dict
)
plt.setp(b.patches, linewidth=0.5)
b1 = sns.barplot(x="s_mapper",
y="util",
data=df.sort_values('util'),
order=labels,
hue='ncores',
hue_order=[4,2,1],
ax=ax,
**style_dict1
)
plt.setp(b1.patches, linewidth=0.5)
ax.set_ylabel('')
ax.set_xlabel('Time (sec)')
ax.set_yticklabels(labels_mod)
ax.set_axisbelow(True)
ax.grid(which='both', axis='x', color='k')
#ax.set_xscale('log')
ax.set_xlim([0, 5e3])
ax.set_xticks(np.arange(0, 6000, 100), minor=True)
ax.grid(which='minor', axis='x', alpha=0.2, color='k')
ax.get_legend().remove()
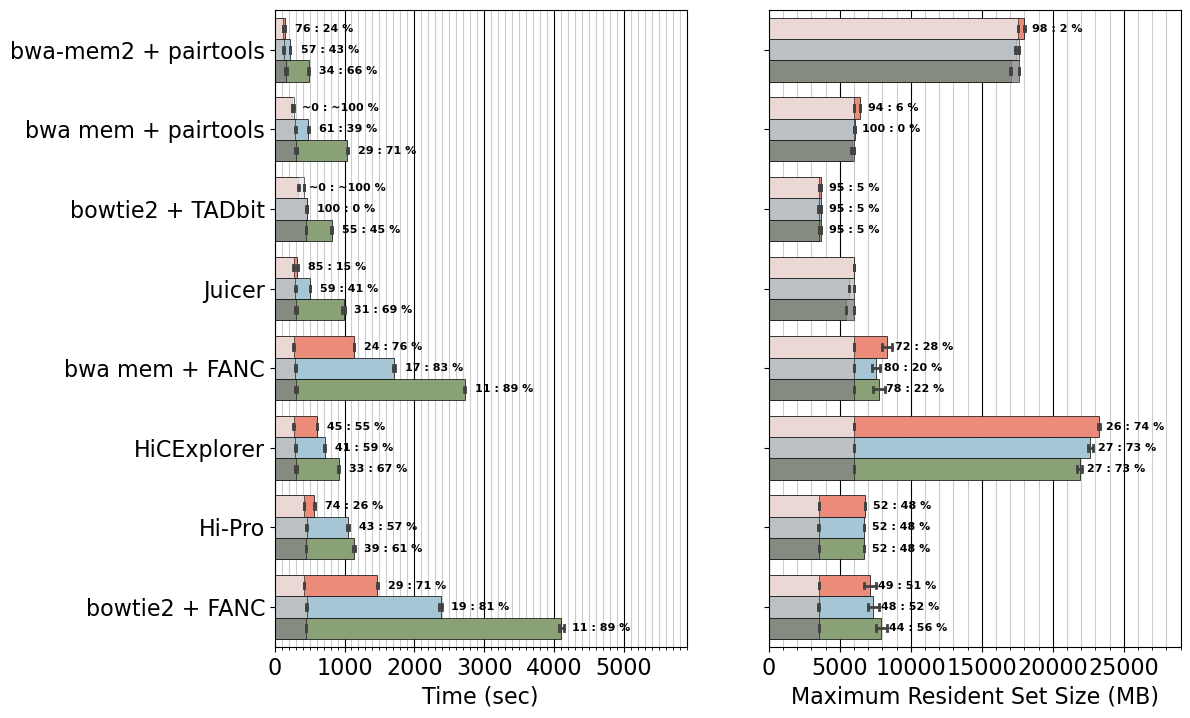
# Add text, runtime percentage out of mapper timing
ncores_order = [4, 2, 1]
for icore, ncores in enumerate(ncores_order):
for ilabels, util in enumerate(labels):
if util=="chromap":
continue
df_target = df.query(f'ncores=={ncores} and util=="{util}"')
mean_target = np.mean(df_target['min'].values)
mean_mapper = np.mean(df_target['min_mapper'].values)
prc = 100 * (mean_mapper) / mean_target
w = b.patches[0].get_height()
if prc>100:
signature = f"~0 : ~100 %"
else:
signature = f"{prc:.0f} : {100-prc:.0f} %"
b.text( s=signature,
x=mean_target+150, y=ilabels + (icore-1)*w,
ha = 'left', va = 'center', fontsize=8, weight='bold')
ax = axes[1]
b = sns.barplot(x="max_rss",
y="util",
data=df.sort_values('util'),
order=labels,
hue='ncores',
hue_order=[4,2,1],
ax=ax,
**style_dict)
plt.setp(b.patches, linewidth=0.5)
b1 = sns.barplot(x="max_rss_mapper",
y="util",
data=df.sort_values('util'),
order=labels,
hue='ncores',
hue_order=[4,2,1],
ax=ax,
**style_dict1
)
plt.setp(b1.patches, linewidth=0.5)
ax.get_legend().remove()
# Add text, runtime percentage out of mapper timing
ncores_order = [4, 2, 1]
for icore, ncores in enumerate(ncores_order):
for ilabels, util in enumerate(labels):
if util=="chromap":
continue
df_target = df.query(f'ncores=={ncores} and util=="{util}"')
mean_target = np.mean(df_target['max_rss'].values)
mean_mapper = np.mean(df_target['max_rss_mapper'].values)
prc = 100 * (mean_mapper) / mean_target
w = b.patches[0].get_height()
if prc>=100:
signature = f""
else:
signature = f"{prc:.0f} : {100-prc:.0f} %"
b.text( s=signature,
x=mean_target+550, y=ilabels + (icore-1)*w,
ha = 'left', va = 'center', fontsize=8, weight='bold')
ax.set_ylabel('')
ax.set_xlabel('Maximum Resident Set Size (MB)')
ax.set_yticklabels(labels_mod)
ax.set_axisbelow(True)
ax.grid(which='both', axis='x', color='k')
ax.set_xticks(np.arange(0, 30000, 1000), minor=True)
ax.grid(which='minor', axis='x', alpha=0.2, color='k')
# fig.suptitle('Benchmark of different Hi-C mapping tools for 1 mln reads (5 iterations)', y=0.99)
# (x, y, width, height)
bb = (fig.subplotpars.left, fig.subplotpars.top+0.002, fig.subplotpars.right-fig.subplotpars.left, 0.2)
# ax.legend(bbox_to_anchor=bb, title="Number of cores", loc="lower right", ncol=3, borderaxespad=0., bbox_transform=fig.transFigure, frameon=False)
plt.savefig("benchmarking_1mln.mappers.pdf")
[ ]: